Each report has its own launch page. However, many of them contain some common functions to assist in
controlling the data.
Use the hamburger button in the upper left corner of the report title
header
for every report run to change
parameters to see different data, a different date, site,
monitor, or any of the criteria used to define the data returned. If you use the browser back button, or click
the Reports link on the page menu bar the report and data you selected will be gone. It might now even return to
the launch page for a previous report. Additionally, the hamburger menu opens the report launch window
for the same report with all previous selections still in place. You can change, add, remove selections
and then click the Display button again to rerun the report.
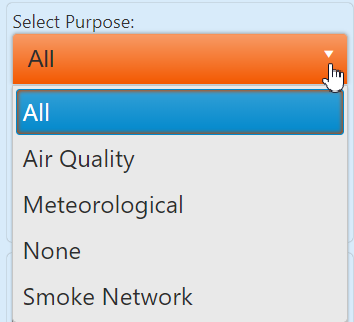
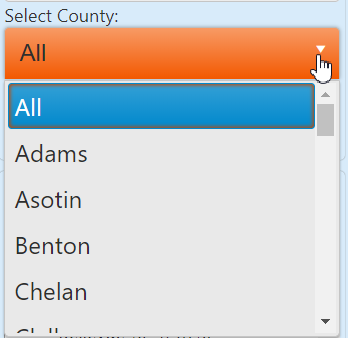
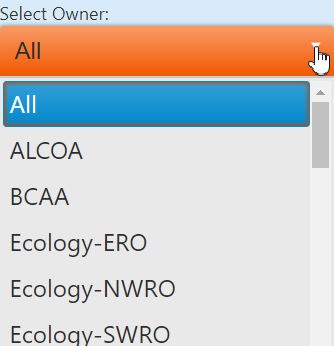
The first three pull-down fields ("Purpose", "County", and "Owner") will filter the list of sites. These fields
are
defaulted to “All” so the Site List contains all sites when the page is first loaded. If you know which sites
you want, simply scroll and select as many as you want. If you want to limit the list from which to select to
sites within one of those criteria, select a filter in any of them. These three selections can be used with one
another, individually, or left set on "ALL." This would be necessary to select multiple sites
that cross over any of the parameters (ex: comparing sites from more than one county). Use one or more of those
first three pulldown selections to filter to sites that pertain to certain criteria. The more
parameters selected, the more limited the site list. So, if you cannot find a particular site, reset these to
“All” and use fewer filters.
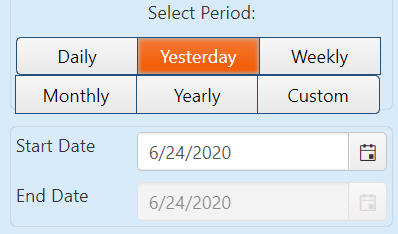
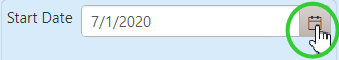
Change dates by typing or selecting from the calendar control .
Daily automatically defaults the start date with the current date. There is no end date when "Daily" is
selected.
Yesterday is the only other automatic date. When selecting Weekly, Monthly, Yearly the end date will
automatically populate for that time frame based on the start date. Change the start date as needed. To get a
full week, month, or year the start date must be far enough in the past to accommodate the selected period. If
the start date is not long enough for the period selected, it will display from the start date entered up
through the most recent data which is today. Please note that any data less than 3 months old has not been
validated and is considered preliminary.
The Custom time period will run only for “today” unless you change the start date. Custom is the only selection
which activates both the start and end date fields for typing or selecting the dates from the calendar control.
The default format of most report data is in a table. If you run the report in table view you can change it to
line
chart, and export to Excel with the buttons in the top right of the report. In some cases you can
export a
PDF image of the report. Those options appear in many of the reports. Not all reports have the same export and
view styles.
24-Hr PM2.5 Summary – provides one hour PM2.5 readings, for any number of sites, any date range.
Matrix – select one monitor and one site. Select exceedance low and high for a range for the values,
period (daily, yesterday, weekly, monthly) and various average types are available against 1-hour data
with many time base transformation options.
Monitors – allows the selection of particular monitor types for one or more sites over any date
range. Various average types are available against 1-hour data with many time base transformation
options.
Multi Sites – returns all monitor types for one or more sites over any date range. Various
average
types are available against 1-hour data with many time base transformation options.
Site List – allows the selection of a particular site over various data ranges.
Dispalys the same information that is available on the map by clicking on the dot.
Sites – allows the selection of particular monitor types for one sites over any date range.
Various
average types are available against 1-hour data with many time base transformation options.
AQI Index – displays the Air Quality Index number, associated with all active
sites for the most current hour. This can be saved as a PDF or exported to Excel.
AQI 24HR Summary – displays the Air Quality 24HR Index summary associated with all active
sites for previous days and the Air Quality Index number for the most current hour.
This can be saved as a PDF.
Wind/Pollutant Rose – defaults to wind rose. Click pollutant rose to
change. Select a site. The
direction monitor defaults to Nephelometer. This can be changed. Sectors defaults to 16 but can be any
number between 4 and 32.
nY/XY – displays data from all monitors for the sites selected. Average Type defaults to plain
old
average but has several option like min, max, running, forward etc. You probably should know what you
are
looking for to use this report.
The smoke network includes sites Ecology monitors to observe smoke impacts for wildfire smoke monitoring. The
smoke network includes the following air monitoring sites: Chelan, Colville, LaCrosse, Leavenworth, Mesa, Moses
Lake, Pullman, Ritzville, Rosalia, Twisp, and Winthrop.
 in the upper left corner of the report title
header
for every report run to change
parameters to see different data, a different date, site,
monitor, or any of the criteria used to define the data returned. If you use the browser back button, or click
the Reports link on the page menu bar the report and data you selected will be gone. It might now even return to
the launch page for a previous report. Additionally, the hamburger menu opens the report launch window
for the same report with all previous selections still in place. You can change, add, remove selections
and then click the Display button again to rerun the report.
in the upper left corner of the report title
header
for every report run to change
parameters to see different data, a different date, site,
monitor, or any of the criteria used to define the data returned. If you use the browser back button, or click
the Reports link on the page menu bar the report and data you selected will be gone. It might now even return to
the launch page for a previous report. Additionally, the hamburger menu opens the report launch window
for the same report with all previous selections still in place. You can change, add, remove selections
and then click the Display button again to rerun the report.